Price-Driven Surge Pushes Canada Back into Surplus
Merchandise Trade March 2026

Jasleen Trehan
Share:
Canada’s trade story looks like it just achieved liftoff, but I’m not convinced it’s sustained acceleration yet. Exports jumped 8.5% in March, while imports pulled back, pushing the balance into a $1.8 billion surplus — the strongest since September 2025.
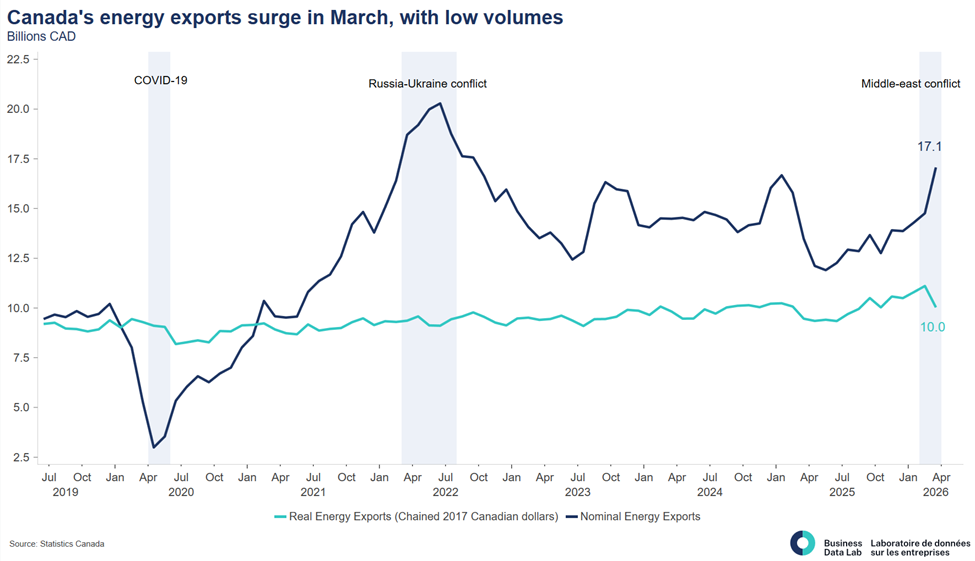
But this is still very much a price-driven story stemming in no small part from the war in Iran. Higher oil prices and a surge in gold shipments are doing most of the heavy lifting, while export volumes edged down 0.3%, so the headline strength is masking a softer underlying demand picture.
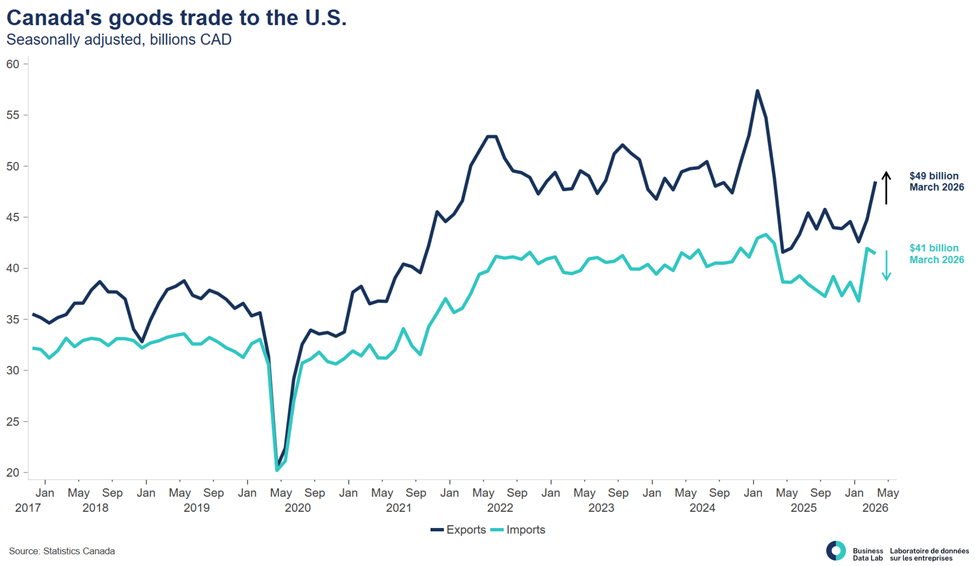
We’re also seeing some movement in how Canada trades. The surplus with the U.S. widened, supported by energy and autos, while the deficit with non-U.S. partners narrowed for a second straight month to its smallest since early 2025, driven by strong flows in gold, energy, and agriculture. That points to some progress on diversification but it’s still largely being driven by commodities rather than a structural shift.
When you zoom out to the full quarter, the story becomes more volatile. Over Q1, import growth outpaced exports at times, driven by swings in energy and metal products, pointing to a trade environment that remains heavily commodity driven. So, while March looks strong, the broader picture is still uneven. Trade flows are moving, but Canada is not yet building consistent, broad-based momentum in external demand.”
Headline
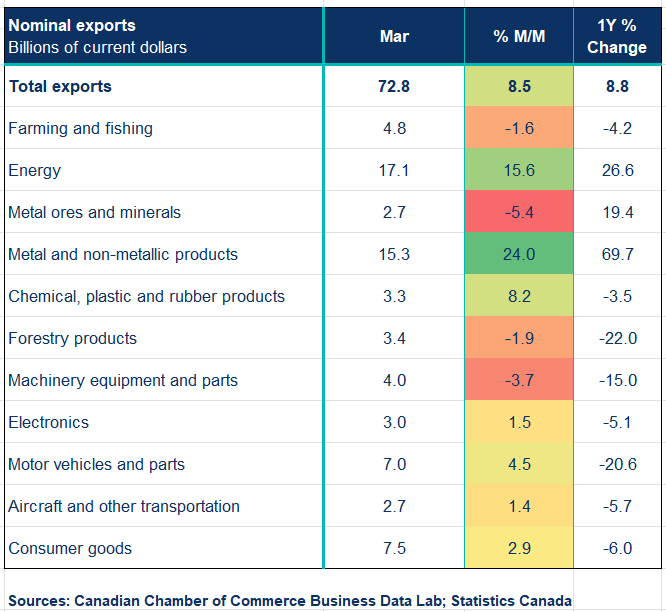
Canada’s merchandise exports rose 8.5% to $72.8 billion in March, while imports declined 1.6% to $69.3 billion, resulting in a $1.8 billion trade surplus — the largest since September 2025. In real (volume) terms, exports edged down 0.3%, while imports fell 2.0%, pointing to weaker underlying trade activity despite strong nominal gains. The monthly movements were largely driven by a 15.6% increase in energy exports, reflecting higher crude oil prices, and a 24.0% surge in metal and non-metallic mineral products, led by a sharp rise in gold shipments particularly to the United Kingdom, as gold prices eased in March. These gains were partially offset by declines in categories such as farming and fishing (-1.6%), forestry (-1.9%), and machinery and equipment (-3.7%), highlighting the uneven and concentrated nature of export growth.
Key Takeaways
- Exports rose 8.5%, with gains concentrated in a few key categories. Energy exports jumped 16%, driven by higher crude oil prices, while metal and non-metallic mineral product exports surged 24%, largely reflecting a 38% increase in gold shipments, particularly to the United Kingdom. Motor vehicles and parts rose 4.5% as production disruptions eased. Despite these gains, export volumes edged down 0.3%, with declines in sectors such as agriculture, forestry, and industrial machinery, highlighting uneven underlying demand.
- Imports declined 1.6%, driven by a 2.0% drop in volumes, reversing some of February’s strength. The pullback was led by declines in aircraft and pharmaceutical products following earlier spikes, alongside broader softness across several categories. While partly reflecting volatility, the decline also points to some cooling in domestic demand.
- Exports to the United States increased, while imports declined, widening Canada’s trade surplus with its largest partner. Gains were supported by higher energy exports and autos. At the same time, exports to non-U.S. markets remained elevated, with the trade deficit narrowing for a second consecutive month to its smallest since early 2025. Strength was driven by commodities, including gold, energy products, and agricultural exports, reinforcing that diversification remains commodity led.
- Service exports rose 0.5% to $20.4B, while service imports rose 1.7% to $20.4B, shifting services to a small deficit. Combined goods and services moved to a $1.7B surplus.
- Despite March’s $1.8 billion surplus, the broader Q1 picture remains uneven. February’s $5.1 billion deficit and earlier import strength offset much of the late-quarter improvement. The main takeaway is clear: trade was active but not strong—driven by commodity price swings rather than sustained demand—meaning it likely provided little support to Q1 GDP growth.
Implications
- Diversification is progressing but remains narrow, as strong exports to non-U.S. markets and a narrowing deficit are encouraging, yet gains are still heavily concentrated in commodities like gold, energy, and agriculture, pointing to limited structural change in Canada’s trade mix.
- Despite the return to surplus in March, weaker export volumes and earlier Q1 dynamics suggest trade likely provided only modest support to overall economic growth.
Sources: Statistics Canada; Canadian Chamber of Commerce Business Data Lab
Other Blogs

Canada’s economy on pace to rebound in the first quarter

The Bank of Canada sees current interest rate “appropriate” despite energy shock.

Use it while you can: The federal government spends its growth-driven fiscal windfall

A Solid Start, but Signs of Fatigue Emerging: Retail Sales February 2026

Inflation rises on energy shock, but underlying price pressures muted.

Sticky hiring, but wage growth at its highest since 2024: Labour Force Survey March 2025

Volatile Imports Drive Wider Deficit Despite Export Rebound: Merchandise Trade February 2026

January 2026 GDP: Canada’s economy kicks off 2026 on decent footing