Volatile Imports Drive Wider Deficit Despite Export Rebound
Merchandise Trade February 2026

Jasleen Trehan
Share:
On the one-year anniversary of Liberation Day, Canada’s trade data points to an economy still adjusting but not yet stabilizing in a shifting global trade environment.
Exports rebounded 6.4% in February, led by a sharp recovery in autos after January shutdowns, but that largely reflects normalization rather than renewed momentum. The bigger story is on the import side: an 8.4% surge, driven heavily by gold and energy, pushed the trade deficit to its widest since August 2025. What matters for the outlook is that imports are now outpacing exports in both value and volume terms, suggesting trade will likely weigh on first-quarter growth.
There are some constructive signals — exports to non-U.S. markets reached a record high, but the sharp narrowing in the U.S. trade surplus underscores Canada’s continued reliance on North American demand. Taken together, this points less to underlying trade strength and more to volatility, with commodity swings and one-off factors shaping the headline rather than a broad-based improvement in external demand.
Headline
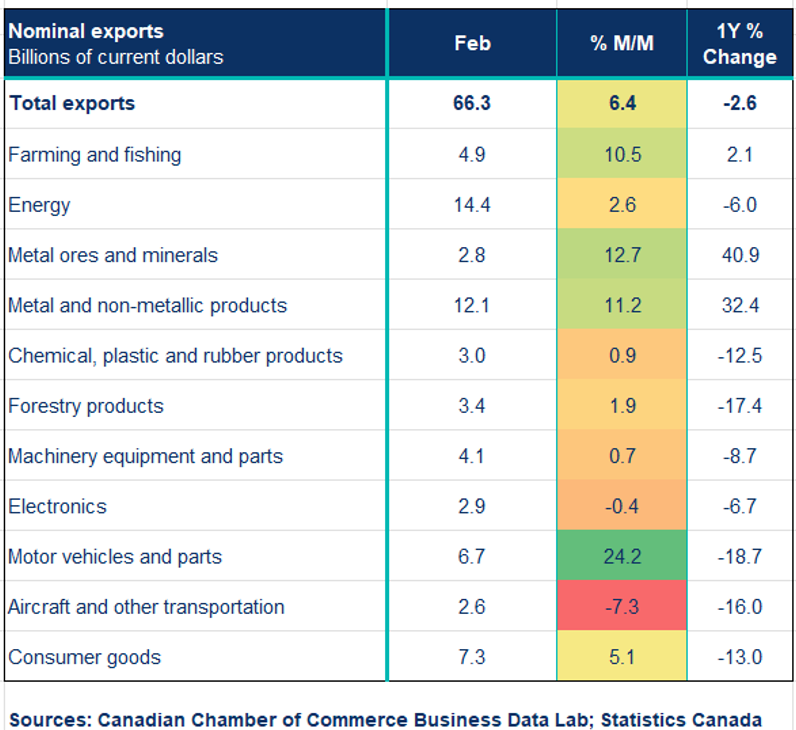
Canada’s merchandise exports rose 6.4% to $66.3 billion in February, recovering from January’s decline, while imports surged 8.4% to a record $72.1 billion. As a result, the merchandise trade deficit widened to $5.7 billion from $4.2 billion in January—the largest since August 2025. In real (volume) terms, exports increased 4.8% and imports rose 7.1%, indicating stronger import demand relative to exports. The monthly movements were heavily influenced by gold, energy, and autos, highlighting the continued volatility in Canada’s trade data.
Key Takeaways
- Exports rose 6.4%, with gains in 9 of 11 categories, signalling a broad-based rebound. Motor vehicles and parts (+24.2%) led the increase, reversing January’s decline as production resumed. Metal and mineral exports (+11.2%) were supported by gold and aluminum, while farm and food exports (+10.5%) strengthened on higher shipments of canola, barley, and soybeans. Despite the breadth, much of the rebound reflects normalization rather than a sustained pickup in demand.
- Imports surged 8.4% to a record high, driven by a 45.6% jump in metal and mineral products — largely gold alongside strong gains in energy (+20.1%) and autos (+5.9%). The broad-based rise underscores how commodity flows and production cycles continue to drive volatility in Canada’s trade data.
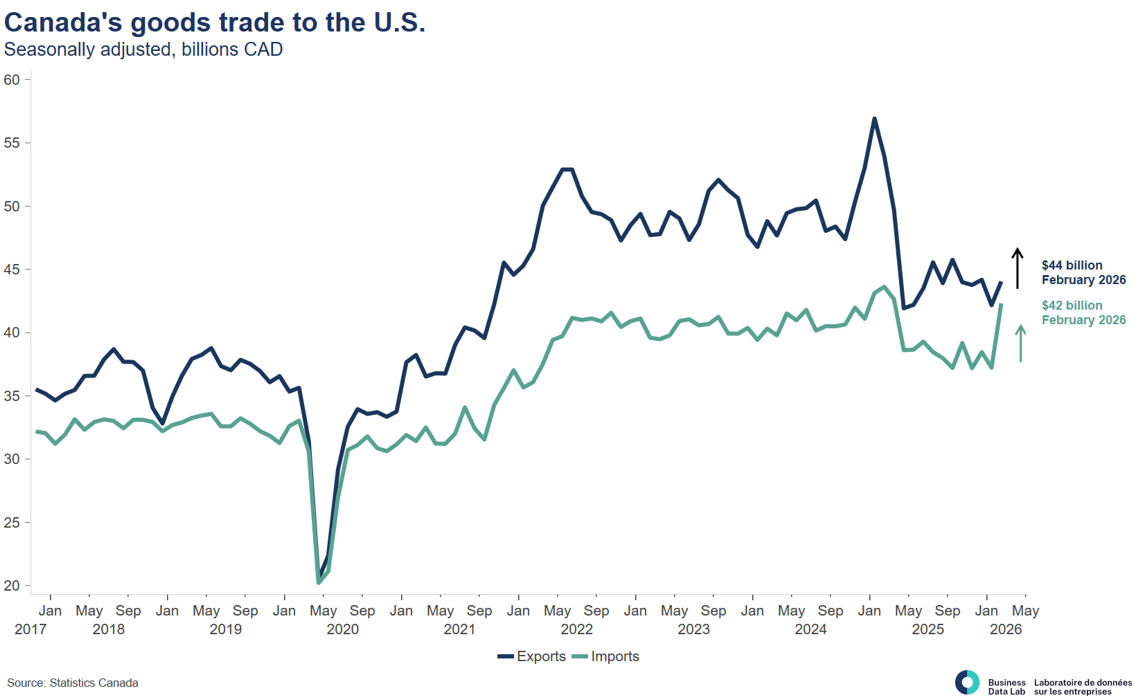
- Exports to the U.S. rose 4.4%, but imports jumped 13.6%, narrowing the trade surplus to $1.7 billion, the smallest since May 2020. Meanwhile, exports to non-U.S. markets increased 10.5% to a record high, led by the UK, Australia, and China. While diversification is progressing, Canada remains highly exposed to U.S. demand.
- Service exports rose 1.5%, while imports fell 0.7%, resulting in a modest services surplus. Combined goods and services trade saw exports rise 5.2% and imports 6.3%, widening the overall deficit to $5.3 billion.
- Trade remains volatile and commodity driven. While exports have rebounded and diversification is gaining traction, stronger import growth, particularly in volume terms, suggests net trade can likely to weigh on first-quarter GDP.
Implications
- Gold, energy, and autos continue to dominate monthly trade movements, limiting the signal from underlying demand trends.
- Record exports to non-U.S. markets signal progress, but the sharp narrowing in the U.S. surplus highlights Canada’s continued reliance on its largest trading partner.
- With import volumes outpacing exports, trade is expected to shift from neutral to a modest drag on first-quarter GDP.
Sources: Statistics Canada; Canadian Chamber of Commerce Business Data Lab
Other Blogs

January 2026 GDP: Canada’s economy kicks off 2026 on decent footing

Strong Start to the Year, but Underlying Momentum Remains Fragile: Retail Sales January 2026
Bank of Canada holds interest rates on cloudy conditions downplaying oil price risk to inflation
The dip before the spike, as base effects bring inflation below 2%

Labour market softens as job losses mount and youth unemployment climbs: Labour Force Survey February 2025

Auto Shutdowns Reverse Canada’s Export Momentum: Merchandise Trade January 2026
Inventory drawdown causes GDP to knee jerk into contraction despite improving fundamentals.

Momentum stalls as consumer shifts into a lower gear: Retail Sales December 2025