Canada’s Productivity Gap Is a Vulnerability We Must Fix
Canada’s productivity problem is not an abstract economic concept. It is an economic vulnerability with real consequences.

Patrick Gill
Share:
Canada’s productivity problem is not an abstract economic concept. It is an economic vulnerability with real consequences.
In a world defined by geopolitical rivalry, fragmented supply chains, and rising economic coercion, countries cannot rely on access, rules or goodwill alone. They must build strength at home. Productivity — how efficiently an economy turns labour and capital into output — is the foundation of that strength.
Yet despite a highly educated workforce, abundant natural resources, and access to global markets, Canada’s productivity has stalled. Output per hour worked has barely grown since 2015, while the United States has continued to pull ahead. Today, Canadian workers produce roughly 70% of the output of their U.S. counterparts — down from about 80% in 2000.
Though productivity growth has slowed across advanced economies, Canada’s divergence from the U.S. is particularly stark. Since the pandemic, U.S. productivity has rebounded and accelerated; Canada’s has drifted — widening the already large gap with our most important trade partner and competitor.
This gap matters. Productivity underpins wage growth, business competitiveness, fiscal capacity, and long-term economic security. And unlike trade shocks or geopolitical risk, it is largely a problem of our own making, shaped by domestic investment choices, business structures, and policy settings. But that also means it’s a problem we can solve.
Canada’s productivity gap with the United States has widened since the pandemic
GDP per hour worked, indexed to 2015 = 100 (PPP-adjusted, constant prices)
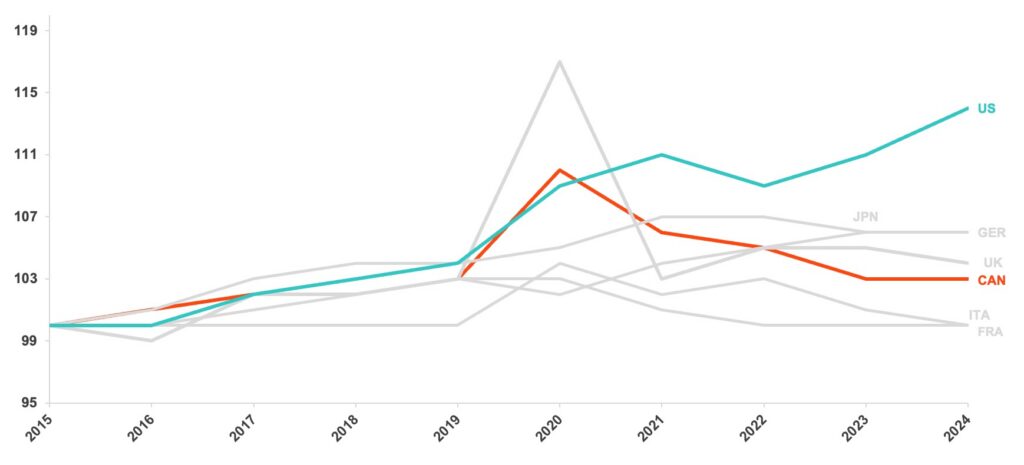
Notes: Japan’s 2024 value is not yet available. The U.S. 2024 value is estimated using data from the U.S. Bureau of Economic Analysis.
Canada’s productivity challenge is complex and structural
Canada’s productivity slowdown is not driven by a single factor. Research consistently points to a combination of challenges:
- Lower business investment in research and development and technology.
- Weaker competitive intensity in many markets.
- Difficulty translating innovation capacity into commercial outcomes.
- A growing share of employment in lower-productivity industries.
- Heavy reliance on exporting raw materials rather than higher-value processed goods.
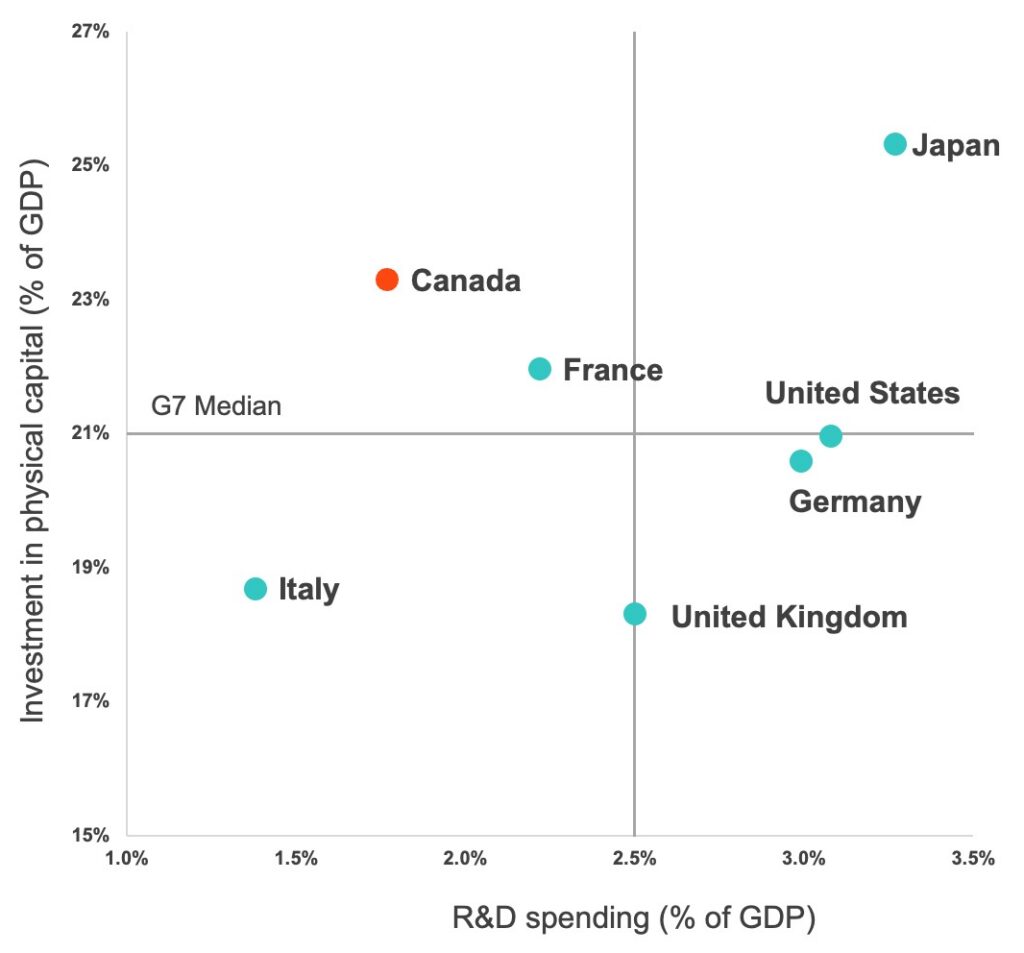
Canada invests heavily in physical assets such as housing and commercial buildings, but lags behind peers in R&D and intellectual capital investment. Over the past decade, Canada’s R&D spending as a share of GDP has been among the lowest in the G7 — a pattern closely associated with weak productivity growth.
Canada’s productivity problem is an investment-mix problem
Canada invests heavily in physical capital. Measured by gross fixed capital formation (GFCF), overall investment as a share of GDP is among the highest in the G7. But a large share of that investment is concentrated in housing and buildings, rather than in productivity-enhancing machinery, equipment, and intellectual property.
At the same time, business expenditure on research and development remains weak. Canadian firms invest significantly less in R&D than their G7 peers, leaving innovation and commercialization gaps that public and academic research alone cannot fill. This imbalance matters for productivity. In a knowledge-driven economy, sustained productivity growth depends less on adding physical structures and more on business-led innovation, technology adoption, and scale. Canada’s investment mix helps explain why high overall investment has not translated into stronger productivity growth.
Investment in physical capital vs R&D by country
GFCF and R&D spending, share of GDP, average (2013–2023)
Over time, these investment choices shape not just productivity levels, but what an economy is capable of producing.
Canada’s productivity problem is a complexity problem
Economic complexity by country
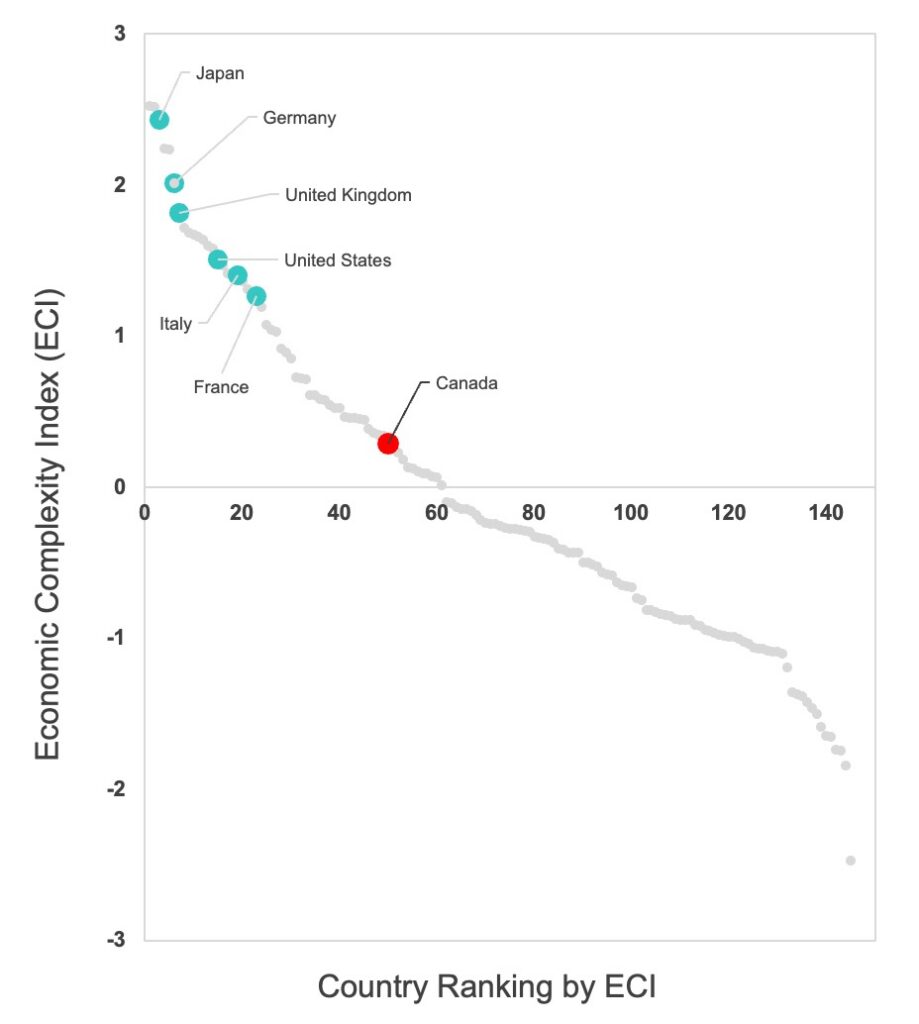
Canada exports large volumes of raw materials rather than processing them domestically, limiting the amount of high-productivity, value-added activity happening at home.
The Economic Complexity Index shows how much productive knowledge (skills, technologies, and experience) goes into what countries produce and export. On that measure, Canada ranks 50th globally, down from the 30-40 range in the early 2000s, and well below all other G7 economies.
Countries that export a wider range of complex goods tend to generate higher productivity, stronger wages, and faster growth. Canada’s position reflects a long-standing challenge: We extract but too often don’t scale, process, or own the high-value activities that drive productivity.
These structural choices show up most clearly at the industry level.
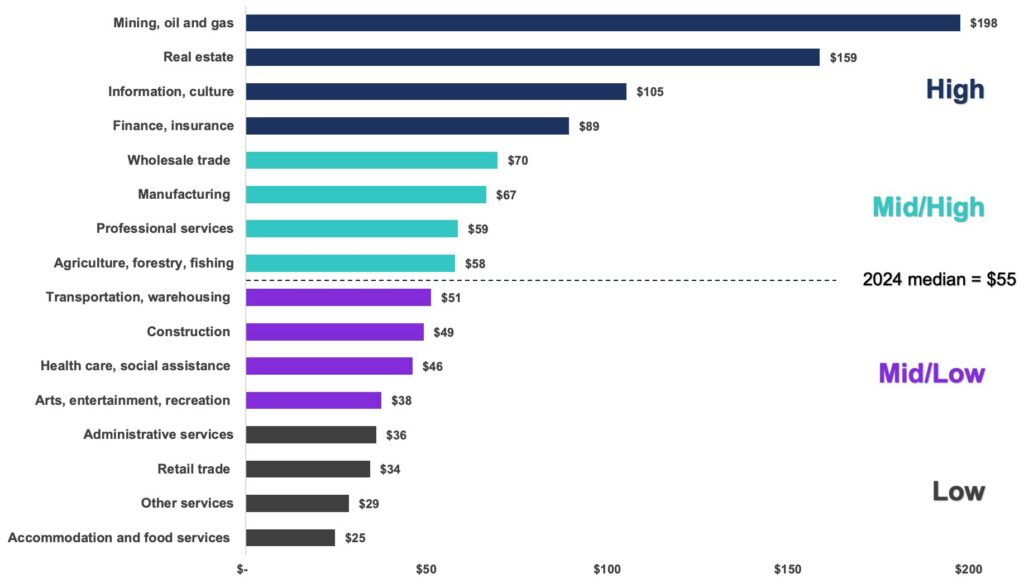
Productivity varies dramatically by industry
National averages mask enormous differences across industries. Highly capital-intensive sectors like mining, oil and gas and real estate generate far more economic output per hour than labour-intensive service industries. Knowledge- and scale-based sectors such as information and culture and finance and insurance also outperform much of the economy.
By contrast, customer-facing sectors such as accommodation and food services, retail trade, and arts and recreation consistently record lower productivity, reflecting thinner margins, limited automation, and high labour intensity.
These differences highlight an important reality for businesses: Productivity is not just about working harder, it’s about capital, technology, scale, and business models.
Productivity by Canadian industry
GDP per hour worked, 2024 (2017 chained dollars)
High
- Mining, oil and gas
- Real estate
- Information and culture
- Finance and insurance
Mid/Low
- Transportation, warehousing
- Construction
- Healthcare, social services
- Arts, entertainment, recreation
Mid/High
- Wholesale trade
- Manufacturing
- Professional services
- Agriculture, forestry, fishing
Low
- Administrative services
- Retail trade
- Other services
- Accommodation and food services
Canada’s employment has shifted toward lower-productivity industries
Distribution of employment by industry group (2000–2024)
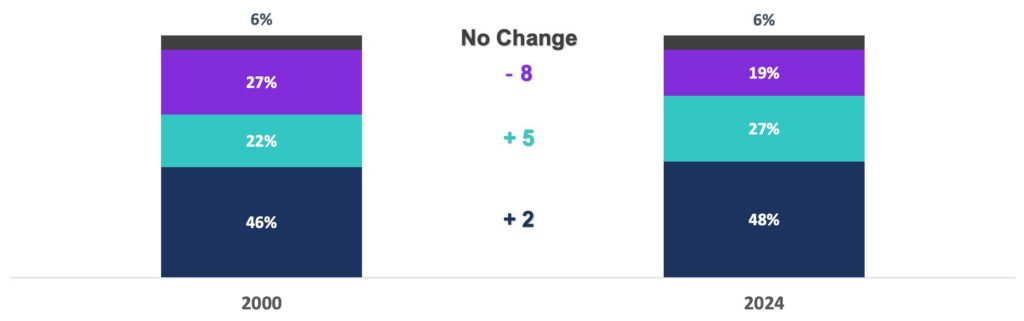
Industry composition explains part of Canada’s productivity challenge, but it does not explain everything. How firms operate within industries matters just as much.
Productivity varies dramatically by industry
Canada’s productivity challenge reflects not just what firms produce, but how productivity varies by firm size. While large Canadian firms have posted productivity trends broadly in line with international peers, small firms (1–99 employees) continue to lag significantly in output per hour worked.
Statistics Canada data show that over the past two decades, small firms have consistently generated lower GDP per hour than large firms, typically reaching only 53% to 76% of large firm productivity, with little evidence of sustained convergence. This persistent gap reflects structural differences in capital intensity, technology adoption, and access to scale advantages that large firms are better positioned to exploit.
This underperformance has economy-wide consequences. Compared with the U.S., Canada’s labour productivity gap is partly driven by the small business sector. Canadian small firms fall further behind large firms than their U.S. counterparts and account for a larger share of business-sector GDP. As a result, lower productivity among small firms exerts a disproportionate drag on aggregate output per hour.
Closing small firm productivity gaps is critical to Canada’s growth outlook and resilience. AI and other technologies could help small firms overcome scale constraints and raise productivity — but only if adoption and diffusion are supported by the right market conditions and policies.
Firm size and productivity also interact with geography, as firms cluster differently across regions and cities.
Labour productivity by firm size in Canada, 2002–2021
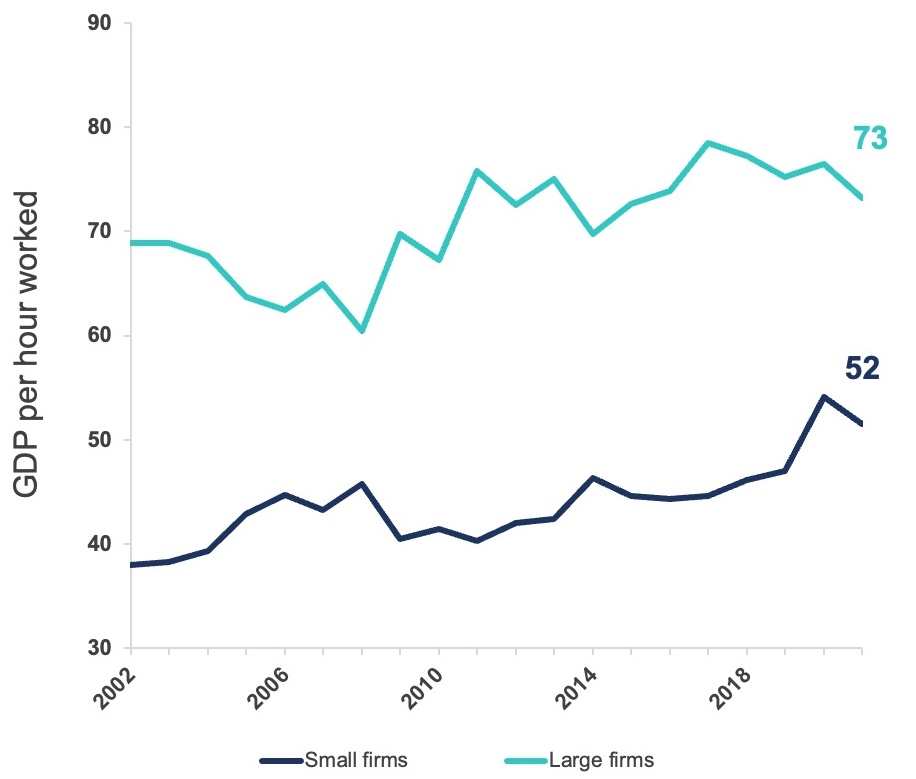
Note: Firm size defined by employment; small firms have fewer than 100 employees.
What explains Canada’s productivity gap with the U.S.?
Contribution of small firms, 2019 (percentage points)
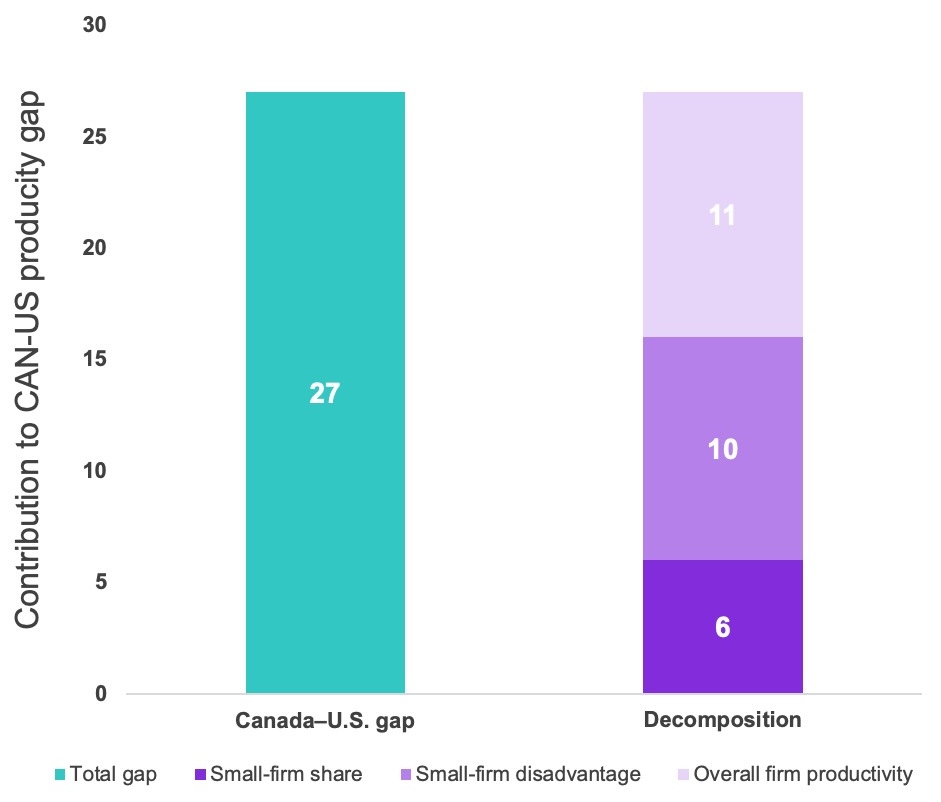
Note: Components sum to total productivity gap.
Insight
Small firms in Canada generate substantially lower output per hour worked than large firms and this gap has persisted over time. Because small businesses account for a larger share of economic activity in Canada than in the U.S., their underperformance is a key contributor to Canada’s overall productivity gap with the U.S.
Productivity is uneven across Canadian city-regions
Productivity also varies sharply across Canada’s major census metropolitan areas (CMAs). Some CMAs consistently outperform others, driven by differences in industry mix, capital intensity, and economic structure. Larger urban economies tend to post higher productivity levels, but size alone does not tell the full story. Even within the same industry, performance can differ significantly from city to city. Understanding these local differences is critical for business leaders making decisions about investment, expansion, workforce planning, and competitiveness.
GDP per worker by CMA, 2024
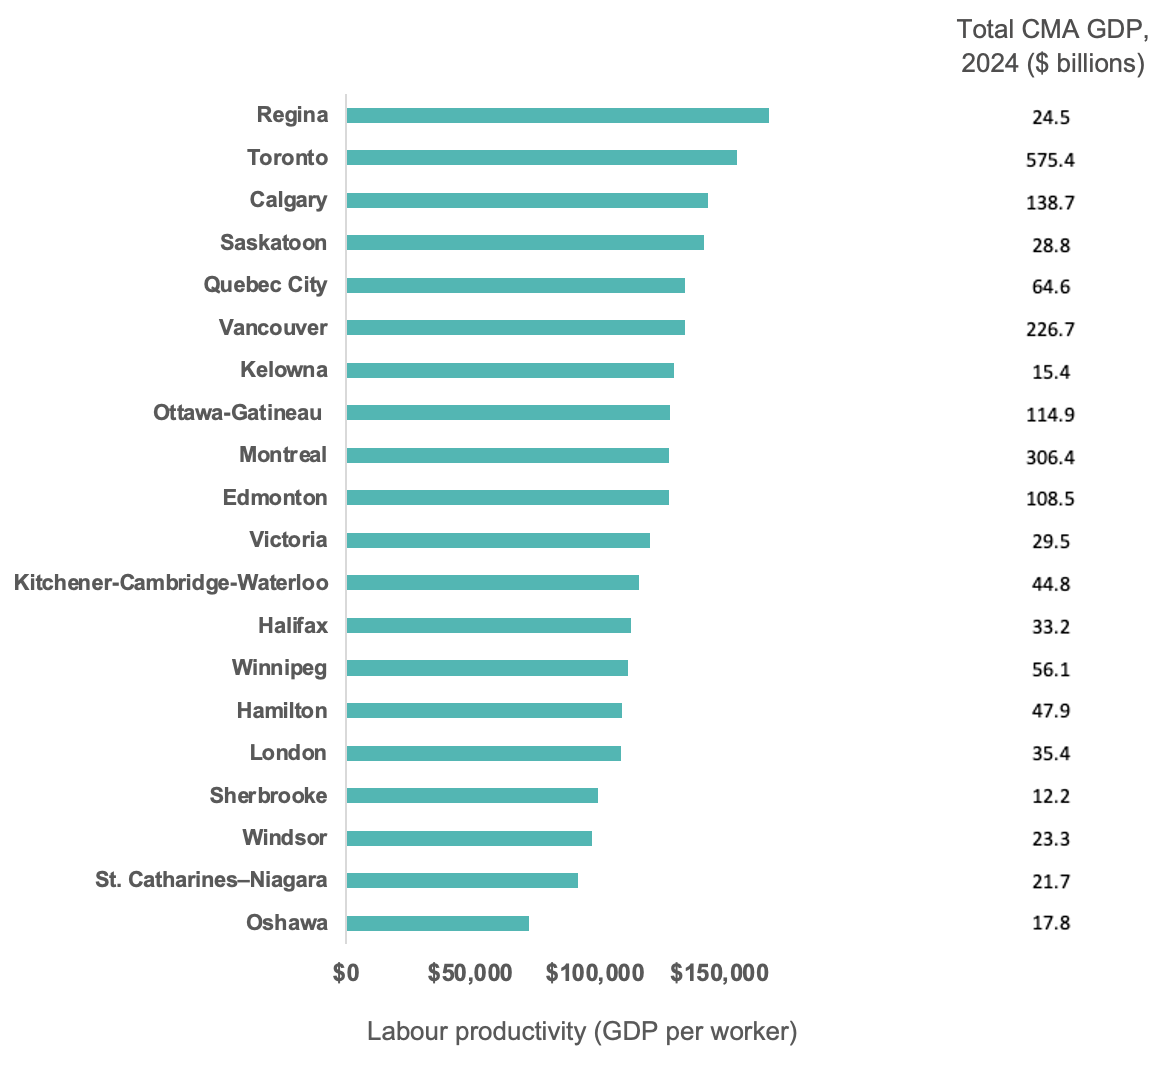
Notes: Projections are anchored to the observed 2022 GDP level and extended forward using the average annual growth rate estimated from historical data over the 2012–2022 period. This approach preserves consistency with the latest observed economic conditions while smoothing short-term volatility in year-to-year growth.
Where you are matters. Productivity varies sharply across largest city-regions
Productivity isn’t national — it’s local. At the CMA level, Canada’s productivity performance is sharply uneven. In 2024, leading CMAs such as Regina, Toronto, and Calgary produce about 50% more GDP per worker than lower-ranked CMAs including Oshawa, St. Catharines–Niagara, Windsor, and Sherbrooke. These differences reflect structural factors (industry mix, firm size, and capital intensity) that national averages can hide. That’s why a city-and-industry lens matters — tools like the Canadian Industry Tracker help pinpoint where productivity strengths and gaps are actually concentrated.
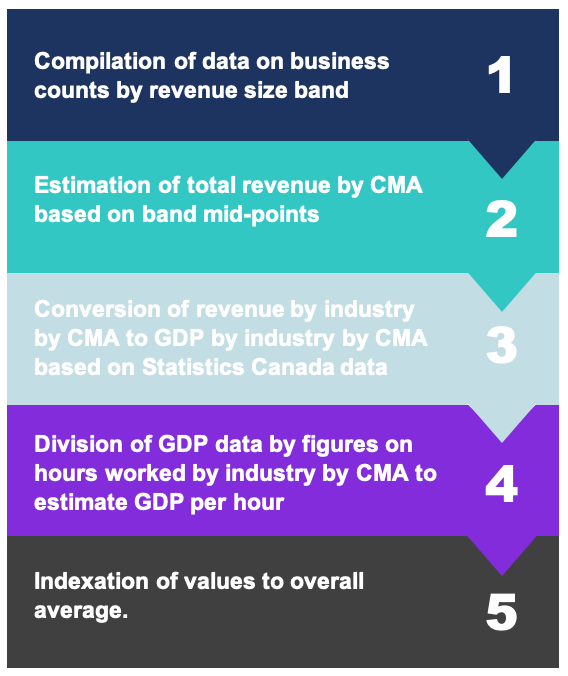
A new local lens: Introducing the Canadian Industry Tracker
To better understand how productivity and business performance vary within and across economic regions, the Business Data Lab has launched the Canadian Industry Tracker — a new, member-only tool that delivers industry-level insights at the city-region level, including experimental estimates of GDP and labour productivity.
To support directional analysis of productivity performance, the Tracker combines estimates of industry output and hours worked within each CMA to enable consistent, comparative analysis across city-regions and industries. Results are presented as an index, designed to highlight relative performance and structural differences, rather than precise firm-level outcomes.
For the first time, businesses and policymakers can explore how productivity differs across industries and cities and relative to local and national benchmarks.
Early results from the Canadian Industry Tracker reinforce several key themes:
- High-productivity industries tend to be capital-intensive and knowledge-driven.
- Productivity leaders vary by city, reflecting local economic structure.
- Some cities significantly outperform national industry averages in specific sectors, while others lag.
- Lower-productivity industries remain widespread across all regions, underscoring the scale of the challenge.
These patterns suggest that there is no single productivity solution. Policies and business strategies must be tailored to industry and place
Productivity in selected industries relative to city average, 2024, (100 = Average of CMA-Industry Range)
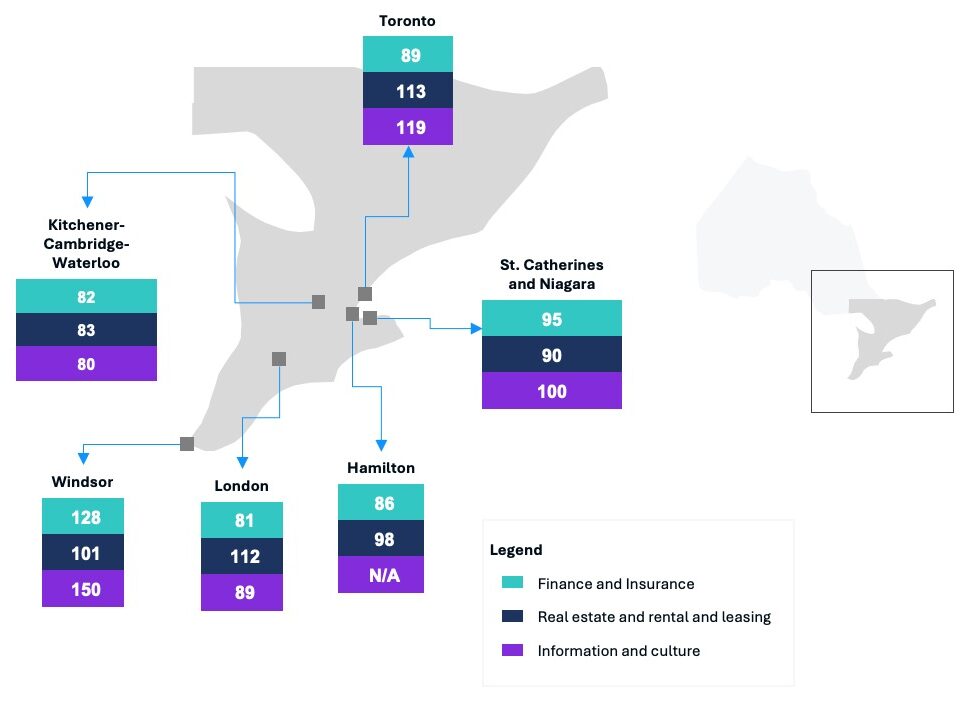
High-productivity industries are consistent, but performance varies by region
Across Ontario’s major CMAs, the same industries that lead productivity at the national level (finance and insurance, real estate, and information and cultural industries) also tend to rank at the top locally. However, we can see their performance varies substantially across city-regions.
In some CMAs, these sectors generate two to four times the average GDP per hour worked within the city, while in others their productivity advantage is far smaller. This regional variation suggests that industry mix alone does not explain productivity outcomes. Local factors play a meaningful role in shaping how productive the same industries are across different places.
A new, experimental lens on local productivity — with important caveats
For the first time, this dataset provides CMA-level, industry-specific estimates of productivity, measured as GDP per hour worked and indexed to local averages. The results broadly align with national patterns, while revealing meaningful variation across cities.
As with any experimental dataset, results should be interpreted with care. Key limitations include smaller sample sizes, the underweighting of large firms’ revenue, and sector gaps where data are not comparable or available. The Business Data Lab is continuing to refine this approach as new data and methods become available.
What this means for business leaders
For businesses, productivity is not an abstract policy debate. It directly affects:
- Costs and margins
- Wage growth and talent attraction
- Competitiveness at home and abroad
The Canadian Industry Tracker offers a new way to benchmark performance, identify structural strengths and weaknesses, and support evidence-based decision-making.
Canada’s productivity challenge is real — but understanding where it shows up, and why, is the next important step toward addressing it.
Conclusion
Canada’s productivity challenge is real – and it is structural. But it is also actionable. Understanding where productivity gaps exist (by industry, firm size, and place) is the first step toward closing them. In a more competitive and fragmented global economy, improving productivity is not just about growth. It is about resilience, opportunity, and economic security. Tools like the Canadian Industry Tracker help make that challenge visible – and therefore solvable.
Other Blogs

Volatile Imports Drive Wider Deficit Despite Export Rebound: Merchandise Trade February 2026

January 2026 GDP: Canada’s economy kicks off 2026 on decent footing

Strong Start to the Year, but Underlying Momentum Remains Fragile: Retail Sales January 2026
Bank of Canada holds interest rates on cloudy conditions downplaying oil price risk to inflation
The dip before the spike, as base effects bring inflation below 2%

Labour market softens as job losses mount and youth unemployment climbs: Labour Force Survey February 2025
Auto Shutdowns Reverse Canada’s Export Momentum: Merchandise Trade January 2026
Inventory drawdown causes GDP to knee jerk into contraction despite improving fundamentals.