Blog /
Merchandise Trade June 2025: Trade deficit widens as imports outpaced modest export gains
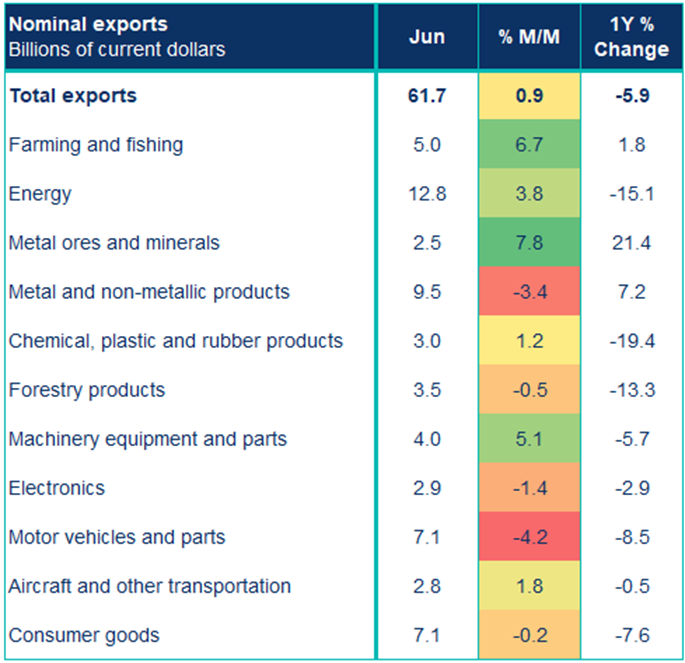
In June, Canada’s merchandise exports rose 0.9% to $61.7 billion—driven by rebounds in energy (+3.8%) and agri-food (+6.7%) despite a pullback in unwrought gold, while imports climbed 1.4% to $67.6 billion on a one-off $2 billion machinery module. The goods deficit widened to $5.9 billion.


Jasleen Trehan
Share:
Canada’s export engine showed tentative stabilization in June, buoyed by strength in energy and agri-food shipments even as precious metals gave back recent gains and key manufacturing sectors remained subdued. The uneven advance masked cooling in auto and non-U.S. markets following a recent peak, while a spike in capital-goods imports underscored volatile investment dynamics, widening the overall trade gap despite a still-healthy balance with America.
Headline
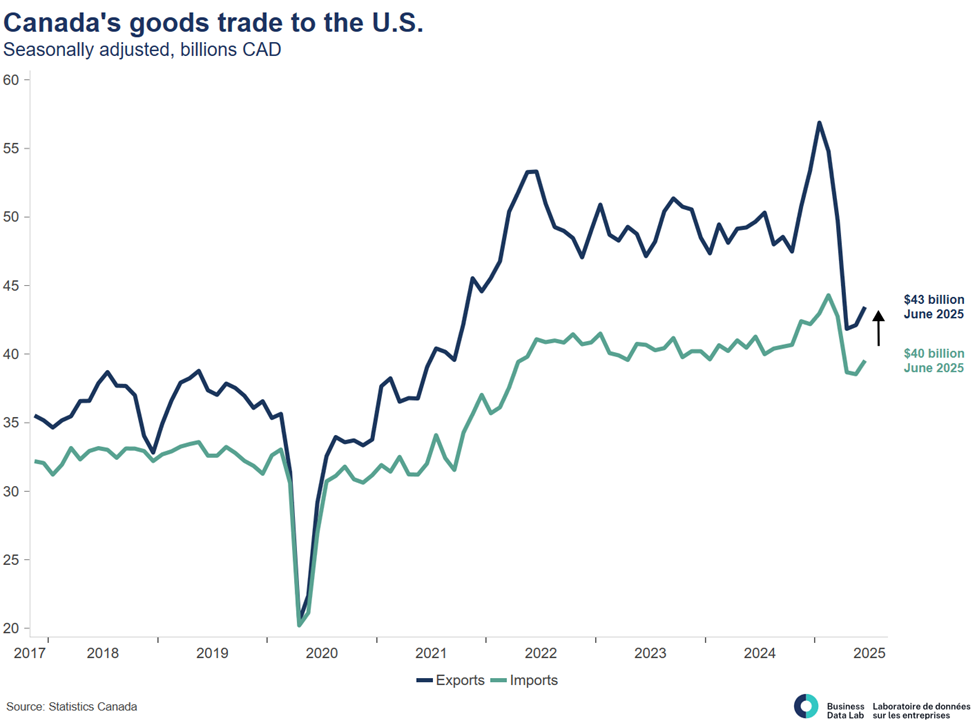
In June, Canada’s merchandise exports rose 0.9% to $61.7 billion—driven by rebounds in energy (+3.8%) and agri-food (+6.7%) despite a pullback in unwrought gold, while imports climbed 1.4% to $67.6 billion on a one-off $2 billion machinery module. The goods deficit widened to $5.9 billion. Exports to the U.S. increased 3.1% to $43.4 billion (–12.5% y/y), non-U.S. exports fell 4.1% to $18.3 billion, and combined goods-and-services trade posted a $6.5 billion deficit.
Key Takeaways
- Merchandise exports climbed 0.9% in June to $61.74 billion, led almost entirely by rebounds in energy (+3.8% to $12.76 billion) and agri-food (+6.7% to $4.99 billion). Excluding those two categories, export volumes slipped 0.4%.
- 6 of 11 sectors grew. Top contributors were metal ores & non-metallic minerals (+7.8% to $2.47 billion) and industrial machinery & parts (+5.1% to $4.02 billion). In contrast, unwrought gold pulled metal products down 3.4%, autos fell 4.2% to $7.07 billion, electronics dipped 1.4%, and consumer goods edged down 0.2%.
- Total imports rose 1.4%, driven by a 27.7% surge in industrial machinery & parts (the $2 billion offshore-oil-project module). Excluding that outlier, import volumes contracted 1.9%.
- Exports to the United States grew 3.1% to $43.44 billion but remain 12.5% below year-ago levels. U.S. imports rose 2.6% to $39.53 billion, trimming Canada’s merchandise surplus with its largest partner to $3.91 billion.
- After May’s record, exports to non-U.S. markets fell 4.1% to $18.30 billion—its first pullback since February—while imports from those countries dipped 0.3%. Year-over-year, non-U.S. exports remain strong, up 14.7%
- Service exports inched up 1.0% to $18.0 billion, and service imports edged down 0.2% to $18.7 billion, leaving the combined goods-and-services deficit at $6.52 billion.
Implications
- The export gain leaned heavily on energy prices and one-off agri-food and machinery shipments, underscoring vulnerability if commodity prices stabilize or project deliveries wane.
- Despite a modest uplift, U.S.-bound exports remain down double digits year-over-year, reflecting lasting tariff impacts and soft demand that may continue unless policy shifts.
- Early-year gains in non-U.S. markets have receded, highlighting the challenge of broadening export engines beyond a few commodities and partners.
- With Q2 exports down 12.8% quarter-on-quarter and the merchandise deficit near record levels, trade momentum into Q3 depends heavily on oil price trends, U.S. policy shifts, and global demand.
Sources: Statistics Canada; Canadian Chamber of Commerce Business Data Lab
Other Blogs

Canada’s economy on pace to rebound in the first quarter

Use it while you can: The federal government spends its growth-driven fiscal windfall

A Solid Start, but Signs of Fatigue Emerging: Retail Sales February 2026

Inflation rises on energy shock, but underlying price pressures muted.

Sticky hiring, but wage growth at its highest since 2024: Labour Force Survey March 2025

Volatile Imports Drive Wider Deficit Despite Export Rebound: Merchandise Trade February 2026

January 2026 GDP: Canada’s economy kicks off 2026 on decent footing

Strong Start to the Year, but Underlying Momentum Remains Fragile: Retail Sales January 2026