Back to the Future: U.S. Imposition of Steel and Aluminum Tariffs
The Canadian Chamber’s Business Data Lab assesses the potential impacts of steel and aluminum tariffs.

Andrew DiCapua
Share:
On February 9, President Trump announced his intention to impose a 25% tariff on all imports of steel and aluminum. The following day, he signed an Executive Order to implement these tariffs, which will take effect on March 12, 2025.
This move essentially revives the “Section 232” tariffs enacted back in March 2018 during the first Trump administration. Initially, Section 232 exempted Canada but this exemption ended after a few months. Following this, Canadian steel exports to the U.S. dropped nearly 40% between May and June 2018, and have since recovered.
Multiple countries, including Canada, implemented retaliatory tariffs, leading to higher input costs for manufacturers. The Canadian government retaliated with equivalent tariffs on U.S. imports, covering steel, aluminum, and various consumer goods.
After being in place for nearly a year, the tariffs were eventually lifted on Canada and Mexico in May 2019, around the ratification of the U.S.-Mexico-Canada Agreement (USMCA), though the Trump administration continued to threaten their reinstatement. Some global producers have faced ongoing tariffs and non-tariffs barriers.
For Canada, these 2018 U.S. tariffs affected $16.6 billion worth of steel and aluminum exports. Ontario and Quebec — Canada’s largest steel and aluminum producers — were disproportionately affected. Canada accounts for merely 1% of the global steel market and 5% of global aluminum market.
Steel and aluminum tariff timeline
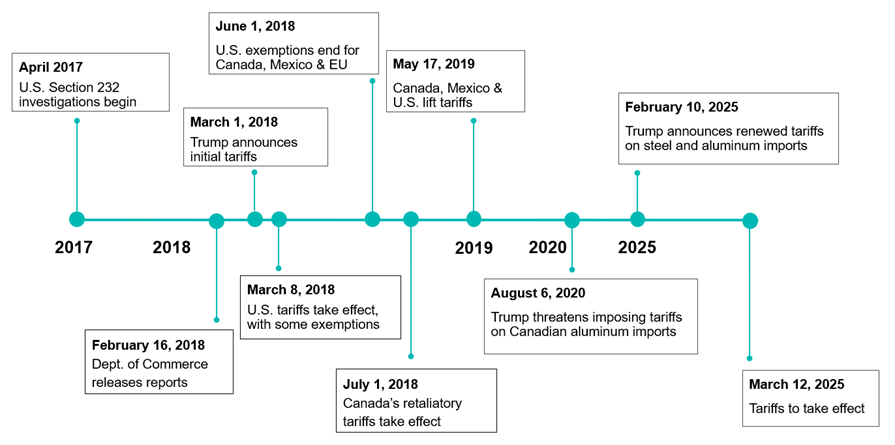
Source: Business Data Lab based on Peterson Institute for International Economics.
How much Canadian steel and aluminum does the U.S. import?
In 2024, Canada exported approximately $7.1 billion USD worth of steel and $9.4 billion USD worth of aluminum to the U.S., accounting for 23% of total U.S. steel imports and 53% of total U.S. aluminum imports. While steel represents a significant portion of total U.S. imports, the country depends far more on Canadian aluminum to meet domestic demand.
The integrated nature of North American supply chains means that American auto makers and manufacturers source cost-effective and reliable steel and aluminum from Canada. Canada has a competitive advantage in aluminum production due to lower energy costs relative to the U.S. and smelting capacity. The U.S. industry has shifted its production from primary aluminum, to recycled and scrap aluminum.
U.S. imports of steel and aluminum, by source
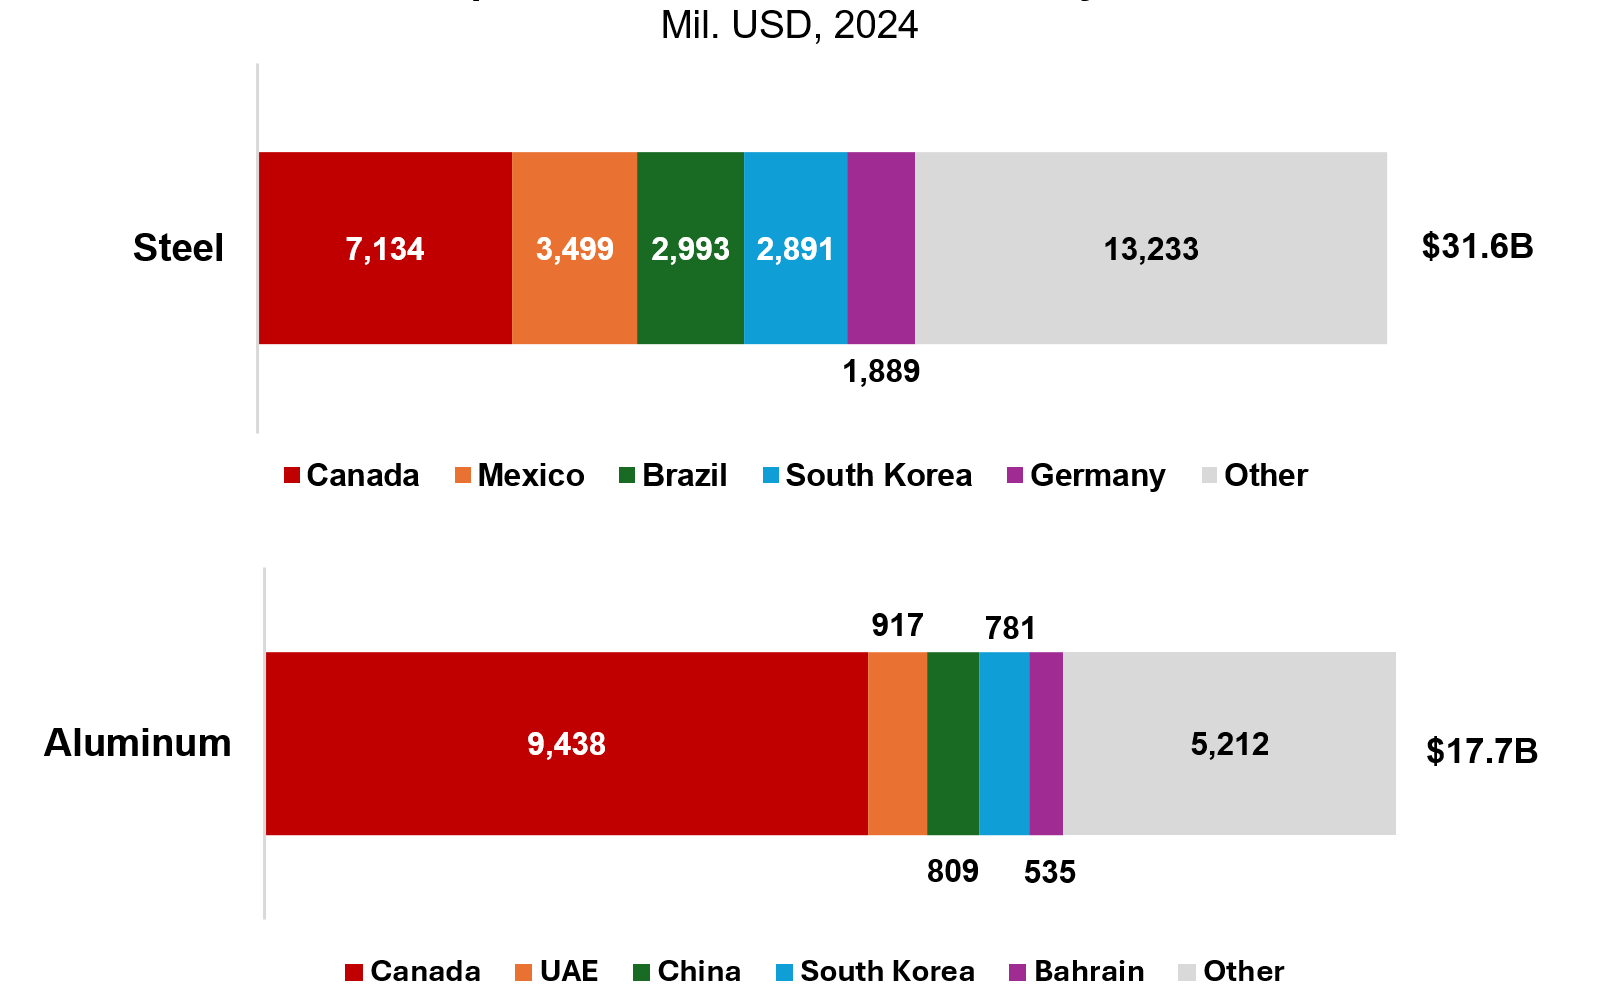
Source: Business Data Lab calculations using U.S. ITA Steel and Aluminum Monitors.
The economic impact of tariffs on Canada
Canada is the country most affected by U.S. steel and aluminum tariffs, with steel and aluminum export exposure (as a percentage of GDP) more than two times the nearest exposed supplier (Steel and aluminum exports from the UAE represent 0.35% of their GDP). That said, steel and aluminum exports account for only about 1% of Canada’s GDP in 2023.
While the broader economic impact of steel and aluminum tariffs is limited, local effects — such as employment losses due to reduced U.S. demand, as caused by the 2018 tariffs — could be significant. Canadian aluminum mostly comes from Saguenay, Quebec, with some capacity in Kitimat, British Columbia. Most steel in Canada is produced in Hamilton and Sault Ste. Marie, Ontario.
While it’s important to diversify to international markets, U.S. protectionism could have impacts to other trade partners and slow overall global growth. This could reduce the demand for Canadian goods.
Retaliatory tariffs on U.S. imports could raise prices for Canadian consumers and lead to higher costs of intermediate goods (i.e. steel and aluminum) for manufacturers. However, the overall impact on inflation would be modest, as only 13% of Canada’s consumer price basket is affected by imported goods. The Business Data Lab estimates that $2.6 billion in export value was lost due to previous tariffs compared to pre-tariff levels ($16.6 billion).
Canadian exports of 2018 tariffed steel and aluminum to the U.S.
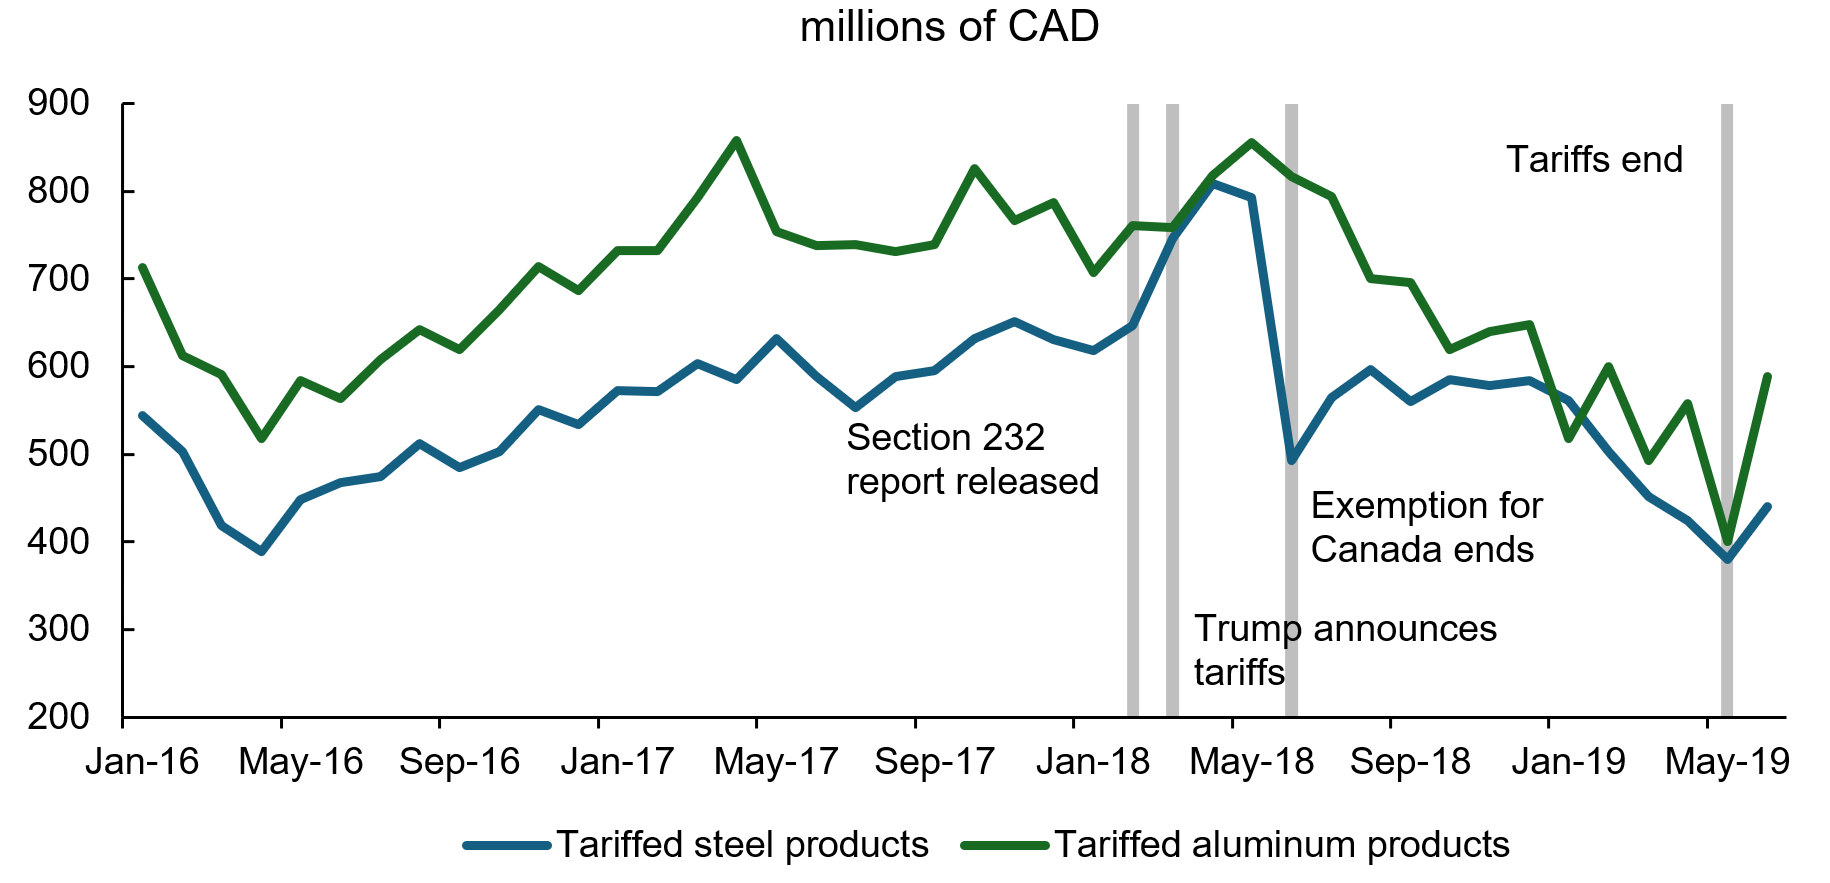
Source: Business Data Lab calculations using Statistics Canada data.
The economic impact of tariffs on the U.S.
The Peterson Institute for International Economics found that the 2018 tariffs imposed significant costs on the U.S. economy with little benefit. Key findings include:
- Steel prices increased by 9% in 2018 compared to the previous year.
- U.S. steel users in downstream industries paid $5.6 billion more for steel in 2018.
- While 8,700 jobs were created as a direct result of the tariffs, they came at a high cost of $650,000 per job.
A report by the U.S. International Trade Commission (USITC) analyzed the Section 232 and 301 tariffs and found that they raised prices, reduced imports, and only marginally boosted production. The economic effects were slightly more favourable for the U.S. aluminum sector than for steel.
Average economic impact of steel and aluminum tariffs, 2018-21
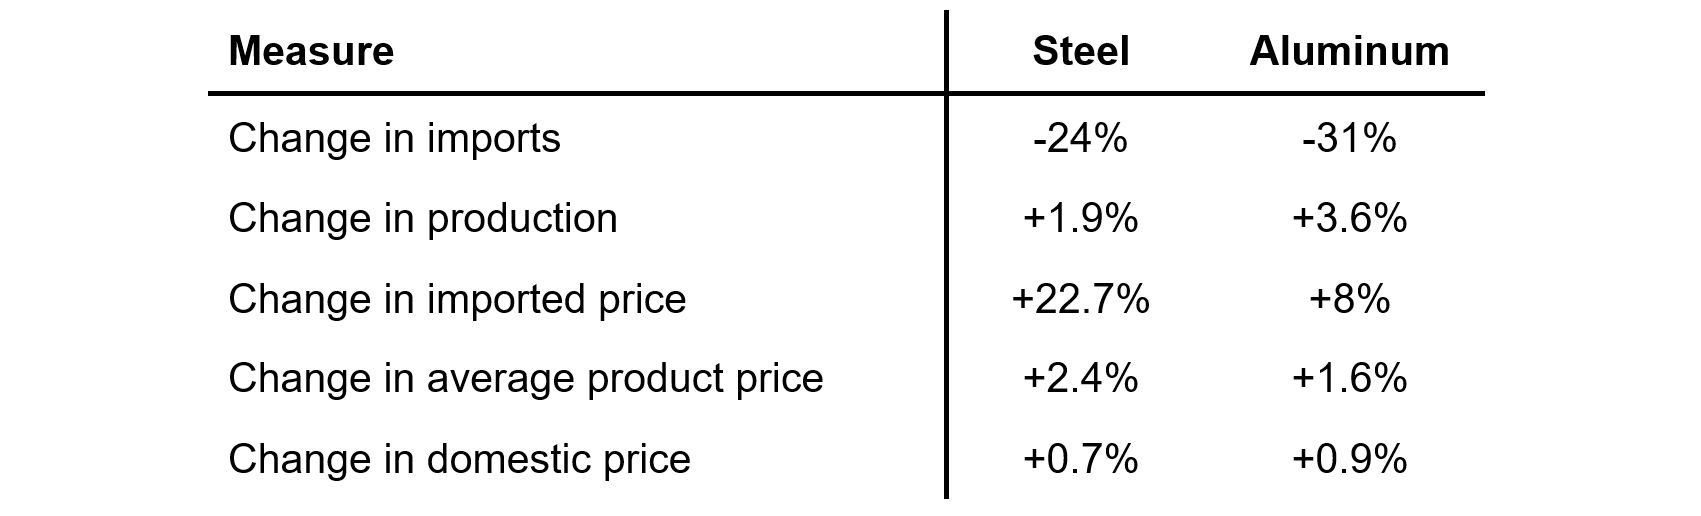
Source: USITC Economic Impact of Section 232 and 301 Tariffs on U.S. Industries, pages 125-126
At the Executive Order signing, President Trump stated that past steel and aluminum tariffs added 120,000 jobs to the sector. However, this statement contradicts multiple economic studies. Further research by the Federal Reserve found that these tariffs raised relative producer prices and reduced manufacturing employment by 0.6%, equating to over 75,000 lost jobs by mid-2019.
Steel and aluminum capacity utilization rates have declined in recent years despite tariff protections. The primary metals sector capacity utilization rate in the U.S. hasn’t maintained 80% over the past few decades, which is considered the benchmark for a booming manufacturing sector.
U.S. primary metals capacity utilization
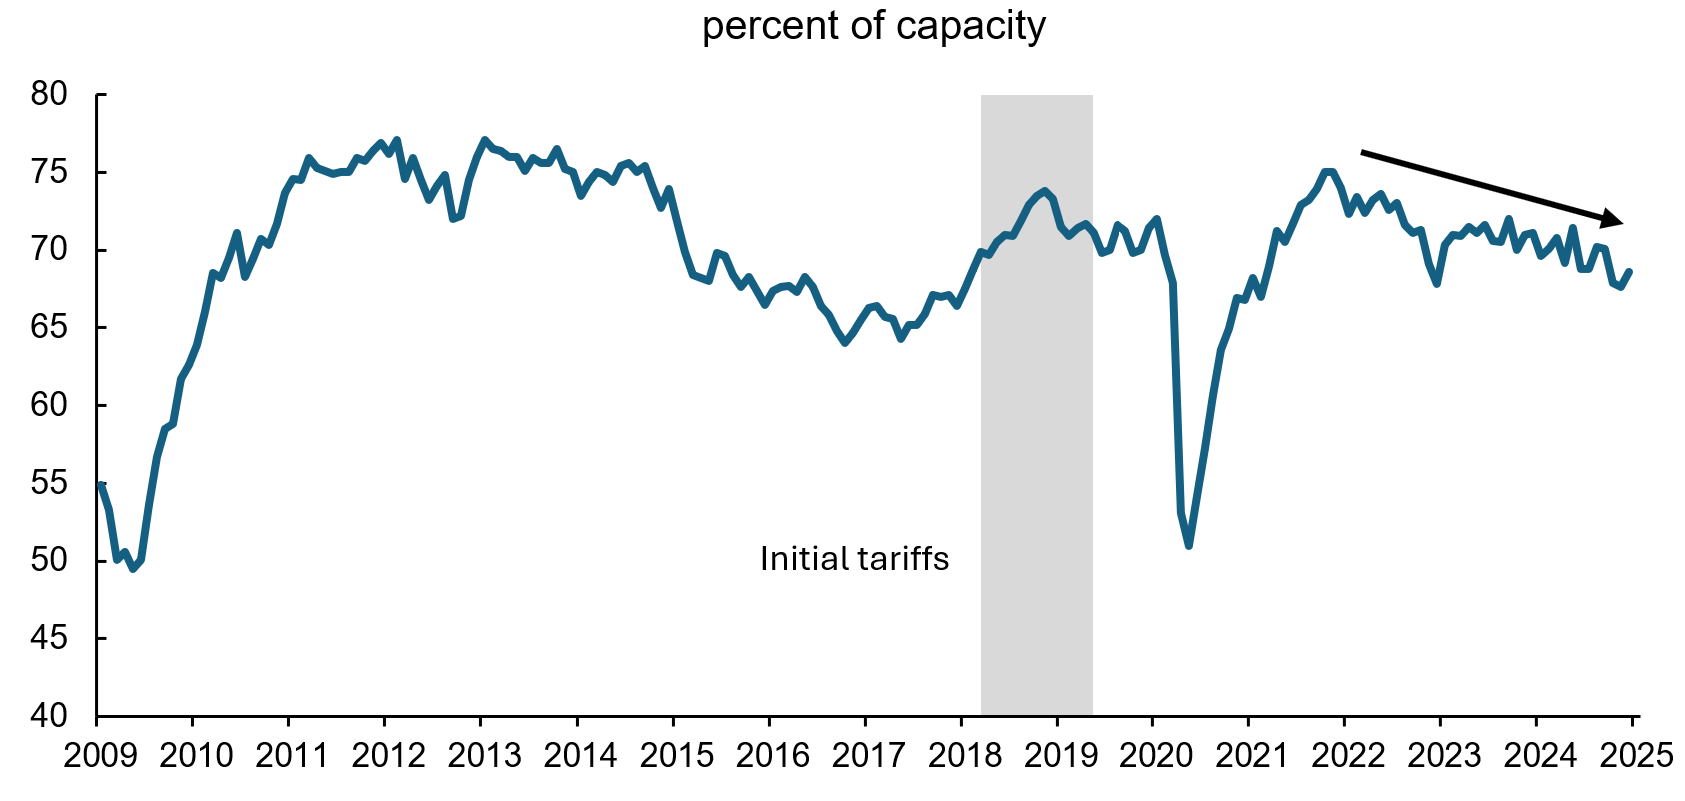
Note: NAICS 331 (primary metals). Some countries were still impacted by tariffs beyond 2019.
Source: Haver Analytics
Political implications
Research by Trade Partnership Worldwide estimates that additional tariff-related costs will total $11.4 billion USD and will disproportionately impact Trump-backing states more than those that backed Vice-president Harris. This could create political pressure on the Trump administration if rising prices for intermediate and final goods make domestic industries less competitive.
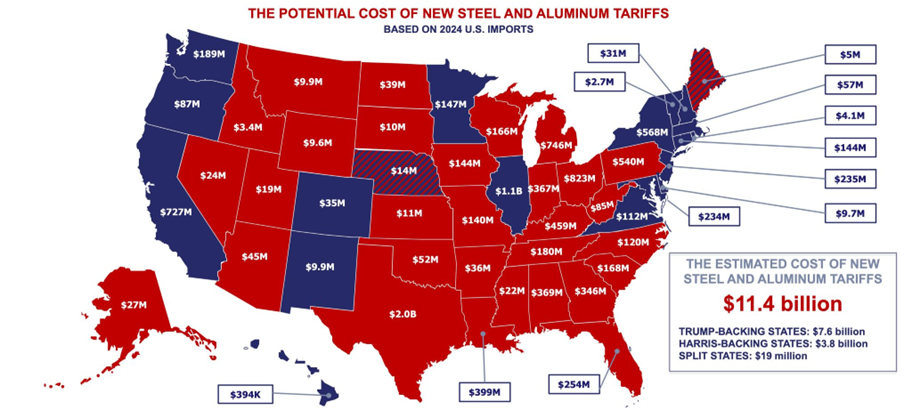
Source: Trade Partnership Worldwide LLC
Conclusion
It remains unclear what criteria the U.S. administration would assess to remove these tariffs. The Executive Order references a “surge” in steel and aluminum imports, and data from the U.S. International Trade Administration show that imports are well within the recent average and December 2024 data points to slight annual declines for both products.
With these latest tariffs, free-trade access to the U.S. market is once again under threat for Canadian companies. Both industries play a part in the integrated North American supply chain, and while these specific tariffs may not deliver as severe a hit to the Canadian economy, they represent yet another escalation in trade tensions. This won’t be the last tariff threat, and the ultimate impact on Canadian goods remains uncertain. What is certain, however, is that the trading relationship has changed. Canada cannot afford to stay reactive—we must adapt and strengthen support for Canadian producers to remain competitive in an increasingly unpredictable trade environment.
Other Blogs

Consumers Keep Spending, but the Menu Is Narrowing

The Bank of Canada faces a dilemma as it extends its holding pattern

Canada’s Trade Story Finds New Supporting Cast: Merchandise Trade April 2026

It is green across the board for May’s labour market: Labour Force Survey May 2026

Where Canada’s defence debate goes next

Recession or Resilience? An unexpected first-quarter GDP contraction points to an uphill battle.

Pivot or Peril: Are Canadian Cities Diversifying or Doubling Down on America?

Retail sales defy expectations, but spending may be running out of gas.