Which Canadian Cities Are Most Exposed to Trump’s Tariffs?
The Canadian Chamber’s Business Data Lab crunches the numbers to assess potential tariff impacts using new localized trade data.

Stephen Tapp
Share:
Check out the BDL’s new interactive tool to explore relevant U.S. trade stats for any of Canada’s 41 largest cities.
Even with a 30-day pause, President Trump’s executive order to impose tariffs on Canadian exports to the United States marks a major protectionist shift in U.S. trade policy. A 25% tariff on all Canadian non-energy exports and a 10% tariff on Canadian energy exports to the U.S. (alongside tariffs on Mexico and China) will cause substantial economic disruptions for the global economy. This analysis explores which Canadian cities may be most affected.
Canada-U.S. Trade: A Deeply Integrated Economic Partnership
Canada and the U.S. have built a highly integrated and mutually-beneficial economic relationship over more than a century, with cross-border trade playing a critical role in both economies, as the Business Data Lab (BDL) documented in a previous report. Our updated modelling suggests that Trump’s tariff would cause significant economic problems for Canadians and Americans — potentially even causing a recession.
We subsequently looked below the national numbers to analyze the potential tariff impacts for Canadian provinces. This work revealed particular vulnerabilities for Alberta, Ontario and New Brunswick. This is because these provinces are highly trade-intensive and the vast majority of their exports go to the U.S. market.
This update takes a closer look at the potential tariff impact on Canadian cities, using new localized trade data from Statistics Canada covering the 41 Census Metropolitan Areas (CMAs) with populations over 100,000.
Identifying the Most Tariff-Exposed Cities in Canada
Using this new granular data, we develop a U.S. Tariff Exposure Index that reflects both the U.S. export intensity of a city’s economy and its dependence on the U.S. as a key export destination.
The chart below summarizes the main results graphically:
Canadian cities’ vulnerability to U.S. tariffs
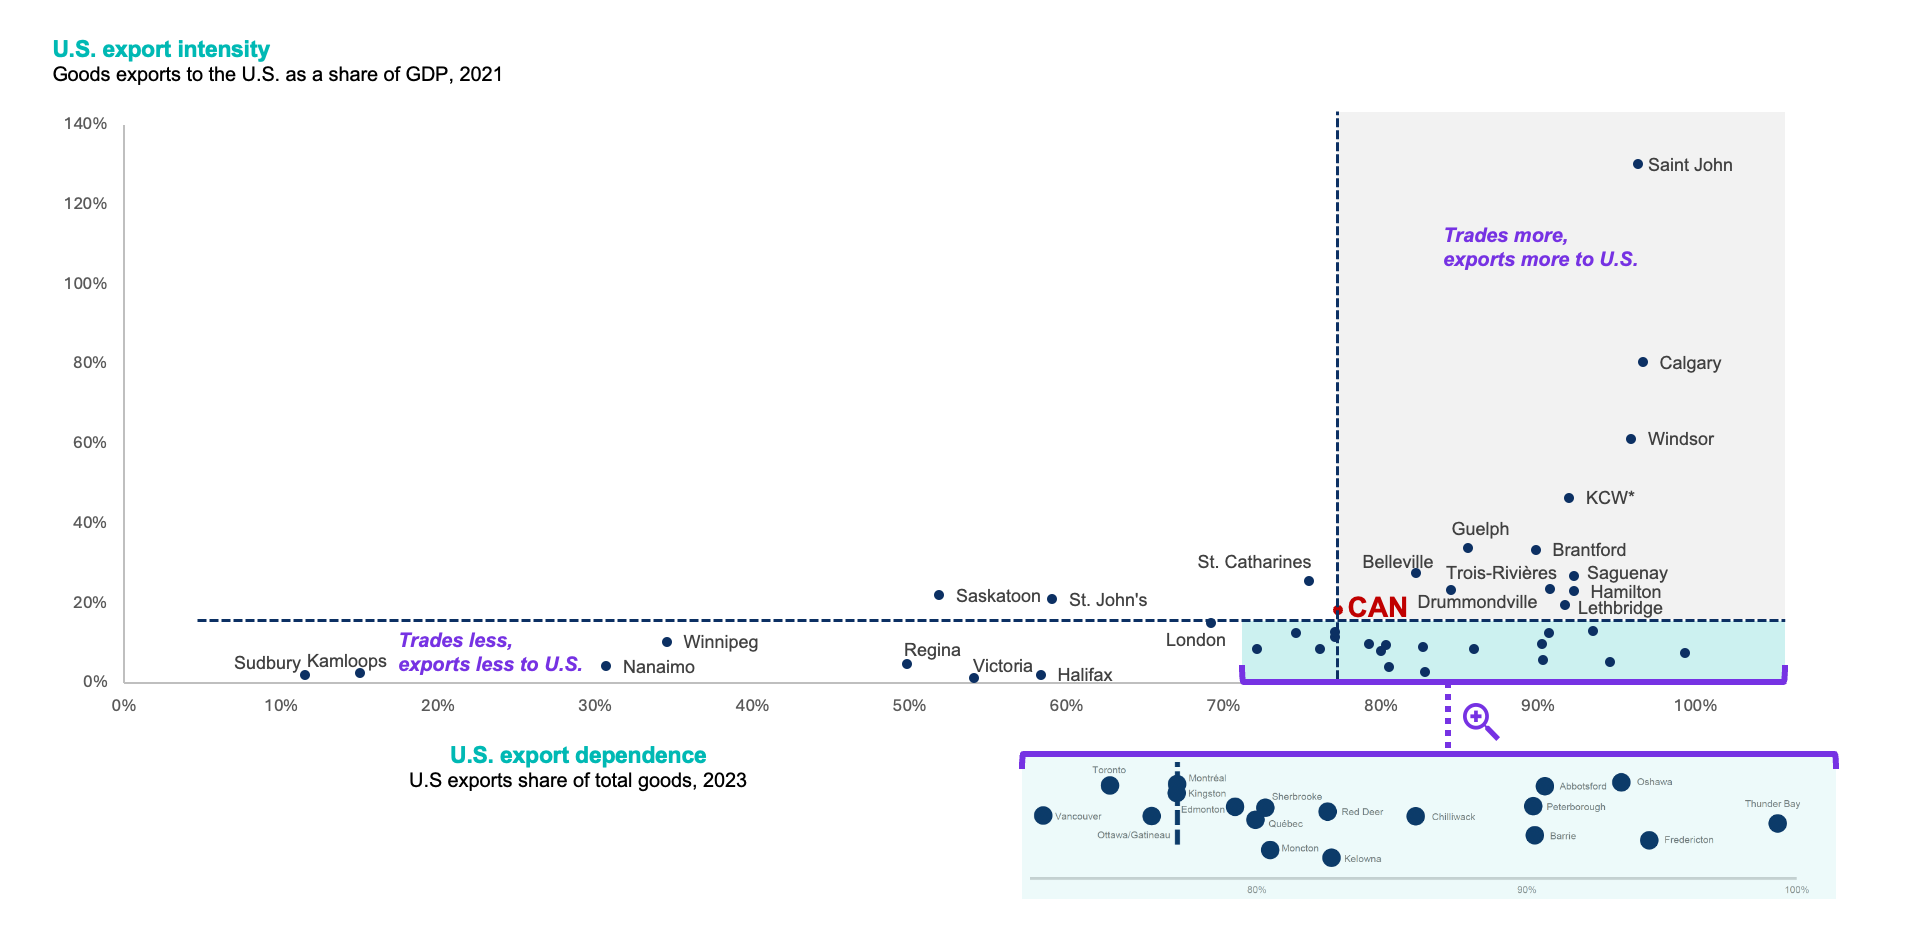
*KCW=Kitchener-Cambridge-Waterloo
Source: Canadian Chamber of Commerce Business Data Lab calculations using Statistics Canada custom Trade by Exporter Characteristics data.
In this chart, cities higher up are more export intensive (i.e., they export more goods to the U.S. as a share of their local economies, shown on the vertical axis), while cities farther to the right depend more on the U.S. as their key export market (i.e., a higher share of their overall goods exports go to the U.S., shown on the horizontal axis). As such, cities farther to the “northeast” in this scatterplot (like Saint John, Calgary and Windsor) are likely to be hit harder by the U.S. tariffs.
The table below provides our U.S. tariff exposure rankings for the 41 Canadian cities. The index simply sums a location’s “excess U.S. trade intensity” and its “excess U.S. export dependence” (both in percentage points relative to the national average). Here’s an overview of some key markets to watch.
Ranking Canadian cities’ vulnerability to U.S. tariffs
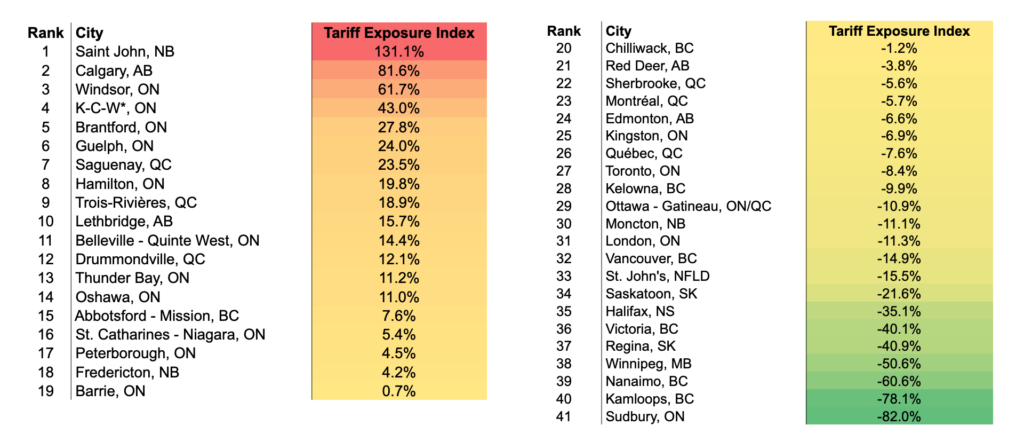
* K-C-W= Kitchener-Cambridge-Waterloo
Source: BDL calculations using custom Statistics Canada trade data by exporter characteristics. Based on goods export intensity to U.S. (relative to local GDP), and export dependence on U.S. market (relative to total exports).
Key Findings: The Most Vulnerable Cities in Canada
Our modelling estimates that the tariff will impose the steepest hit for the value of Canada’s energy exports, which explains why the highest vulnerabilities are for Saint John, New Brunswick, and Calgary, Alberta. The massive value at play from crude oil exports (with energy exports worth over $176 billion in 2024) and concerns of passing higher gas prices onto Americans explain why Trump applied a lower tariff on Canada’s energy exports (10% versus 25% for all other export categories).
Saint John, New Brunswick (1st place)
Home to the Irving Oil Refinery, the largest crude oil refinery in Canada. It can process over 320 thousand barrels of crude daily, with more than 80% exported south of the border. The BDL’s Canada-U.S. Trade Tracker shows that seafood and forestry products are New Brunswick’s other top exports to the U.S., many of which go to Maine.
Calgary, Alberta (2nd place)
Of course we know that Calgary is a major hub that exports crude oil and natural gas to the U.S. Midwest, particularly Illinois. Beef is also a major export.
Southwestern Ontario (3rd place to 6th place)
Our modelling estimates that automotive and parts manufacturing would be the second most negatively impacted sector by U.S. tariffs. Therefore, it’s no surprise to see several cities in Southwestern Ontario occupying the 3rd to 6th spots on the list.
It’s well known that Windsor’s economy depends heavily on auto production, home to major assembly plants for Ford and Stellantis. These production processes involve plenty of two-way trade with Michigan, which is just across the Ambassador Bridge.
Kitchener-Cambridge-Waterloo, Brantford and Guelph are located further east on Highway 401 and specialize in producing auto parts, other advanced manufacturing and machinery and equipment, as well as agricultural exports. For example, Guelph is home to Linamar’s headquarters (Canada’s second largest auto parts maker) as well as Sleeman Breweries.
(As an aside, I suspected Oshawa, another major car producer and home to General Motors, would be higher on the list, however, local GDP data used in our rankings are only available up to 2021. At that time, the pandemic significantly reduced auto exports due to plant shutdowns, retooling, or production delays due to the global semiconductor shortage.)
Hamilton, Ontario (8th place)
The “Hammer” is the steel capital of Canada with facilities for major global producers ArcelorMittal Dofasco and Stelco. This steel is exported as a raw input and used in auto production, construction and other manufacturing.
Quebec’s Most Trade Intensive Cities (7th, 9th, 12th place)
Quebec is home to the next group of higher-tariff-risk cities. The Saguenay-Lac-Saint-Jean region is 7th on the list. It’s responsible for roughly one third of Canada’s aluminum production, with around 85% of this exported to U.S., largely to serve the auto sector, and related production facilities.
Trois-Rivières in 9th spot is another Quebec port city that handles aluminum, forestry and agri-food products. It’s located along the St. Lawrence River between Montreal and Quebec City.
Drummondville in 12th place is a big producer of wood products and residential furniture.
Cities with Lower Exposure
Near the bottom of the list are cities that are less exposed to the tariffs because they trade less intensively with the U.S. and/or have more diversified trade patterns. Several of these cities are located on Canada’s coasts, exporting more to Asia from the West Coast, or more to Europe from the East Coast. In British Columbia this includes Victoria, Nanaimo and Kamloops. On the East Coast it’s Halifax, Nova Scotia. And it appears that Sudbury’s exports of nickel and copper are reaching other international markets beyond the United States.
The stylized map below highlights some major “tariff hot spots” in Canada, which captures our two main energy export centres in Alberta and New Brunswick, Southwestern Ontario’s auto and manufacturing hubs, and Quebec’s aluminum and forestry producers.
Canadian “hotspots” most vulnerable to U.S. tariffs
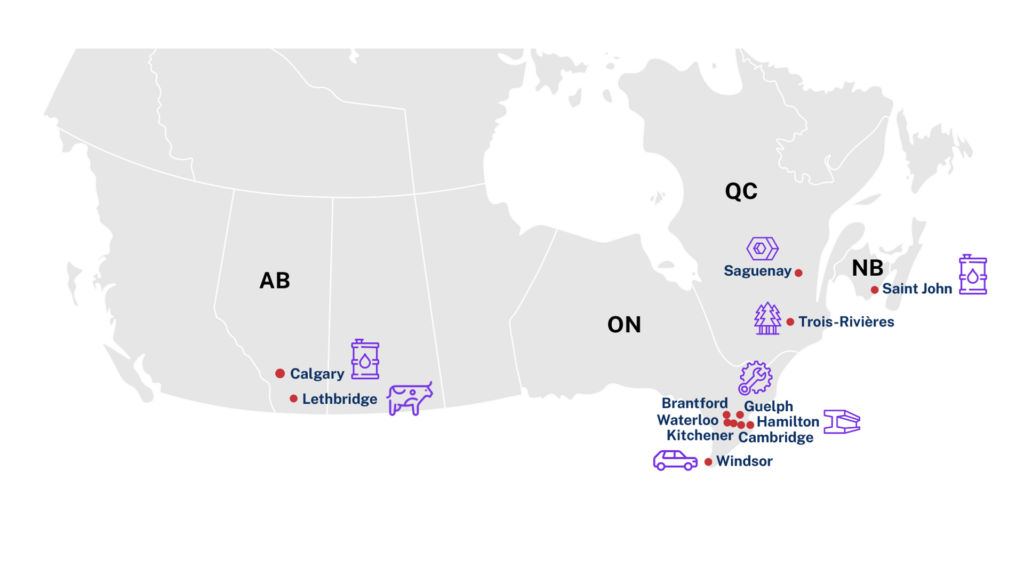
Source: BDL calculations using custom Statistics Canada trade data by exporter characteristics. Based on goods export intensity to U.S. (relative to local GDP), and export dependence on U.S. market (relative to total exports).
Click the interactive tool below to quickly find relevant stats for any of Canada’s 41 largest cities. We’ve pulled together data on goods exported to the U.S. (in values, per capita, as a share of GDP, and a share of total exports), the number of exporters to the U.S., as well as the latest GDP and population stats.
Caveats
These rankings are designed to highlight the relative exposures within Canada to U.S. tariffs. This is complicated and fluid situation and the ultimate impact for Canada’s local economies from these tariffs is highly uncertain. The economic damage done depends heavily on how long these tariffs are in place, or threatened.
We expect more volatility and weakness in the Canadian dollar, which will partly act as a shock absorber.
The ability of Canadian exporters to find alternative markets varies greatly, and is generally easier for bulk commodities, than for specialized machinery, equipment and parts.
Finally, the overall macro-policy response in Canada will be multifaceted with roles for trade policy (the design and use of retaliatory tariffs), monetary policy (the setting of interest rates and inflation control), and fiscal policies (designing support programs for specific geographies and industries).
Informing Policy and Business Decisions
This analysis provides new evidence for policymakers, businesses and the public to help inform ongoing discussion about how Canada can best respond to the monumental challenge brought by unnecessary and unjustified U.S. tariffs. Continued monitoring and strategic policy responses are essential to help mitigate risks, design supports for affected industries and “placed-based” regional responses, and facilitate resource adjustment to what is shaping up to be a major shock for Canada’s economy.
Other Blogs

Consumers Return to the Checkout with Broader Spending

Inflation cools ahead of the summer months

The Bank of Canada gains more confidence in growth prospects despite inflation risk

Canada’s labour market finally caught a bit of a break in June: Labour Force Survey May 2026

Record Exports Signal a Broader Trade Story: Merchandise Trade May 2026

Canada’s economy starts the second quarter with firmer footing

The Inflation Gap Widens as Price Pressures Spread Beyond Energy: May 2026 CPI

Consumers Keep Spending, but the Menu Is Narrowing